
Troubleshooting Endpoint Operations Remote Checks
The Endpoint Operations functionality that is included with vROps is a great way to do more with vROps as a monitoring solution. With Endpoint Operations you install an agent in the guest operating system (or the operating system of a physical server) that can report on all kinds of OS metrics, including service and process availability. Another feature of the Endpoint Ops agent is the ability to perform “remote checks”. These are what I think of as the more traditional type of monitoring checks such as pinging an IP address, checking for a HTTP response from a website, or a response from a TCP port. These types of checks are useful for insuring that services are available from other network locations. For example, the Endpoint Ops agent on your Windows server might be reporting that the IIS service is running and available, but that doesn’t necessarily mean that clients can access it over HTTP from across the network or from another location/site. There could be any number of scenarios that cause availability issues, making monitoring critical services and infrastructure IPs from remote locations invaluable.
I recently setup quite a few remote checks to monitor ICMP availability and ran into an interesting problem. Before diving into the problem and some of troubleshooting that was involved I’ll briefly go over how to create a remote check in vROps. Remember that remote checks are actually performed by an Endpoint Ops agent that is not part of the vROps cluster. So it’s important to think about where the Endpoint Ops agent is in relation to your network architecture and the remote service you are checking. If you are performing a lot of remote checks you’ll probably want to have a couple of Endpoint Ops agents dedicated to performing the remote checks. In my case I deployed a couple of Photon OS 1.0 virtual appliances, installed the Endpoint Ops agent on them, and will use them solely for performing the remote checks. You could just as easily use a Windows server with an Endpoint Ops agent installed to perform the remote checks. I chose Photon for its minimal footprint and optimization for Vmware infrastructure.
Note that Photon OS 1.0 should be used. The agent is not officially supported on Photon OS 2.0 and I ran into issues after the installtion when I attempted to start it on Photon OS 2.0. It is conveniently packaged in an OVA and other formats for download here.
To create a remote check, select the object in vROps that you want to monitor remotely. This can be any object in vROps, keeping in mind that the remote check will be a child of the object selected, so you’ll probably want to select an object that represents the server or system that is being checked. When you install the Endpoint Ops agent it creates an OS object (Windows or Linux) to represent the guest or physical OS the agent is monitoring. Below I’m using the OS object, but the VM could also be used if the server doesn’t have the Endpoint Ops agent installed. On the selected object click the “Actions” menu and select “Monitor this Object Remotely”.

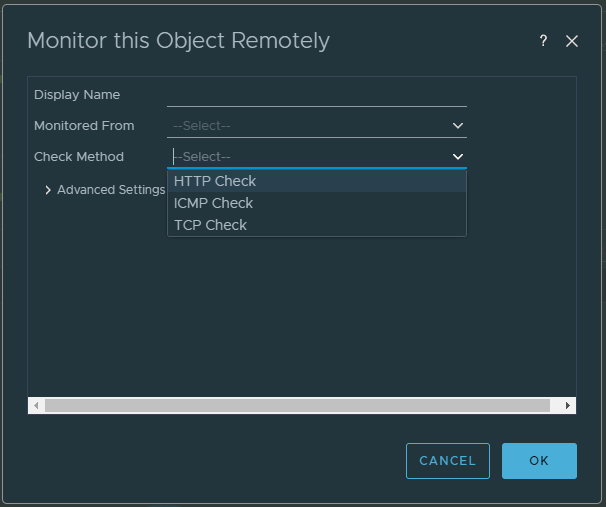
Enter a display name for the remote check. Select an Endpoint Ops agent that it will be “Monitored From”. This is the agent that will perform the remote check. Select the “Check Method” - either HTTP, ICMP, or TCP. Finally enter the address or website to check.
Once created, you can find all of the agents running remote checks and objects monitored remotely under the Environment tab in the “Remote Checks World”:
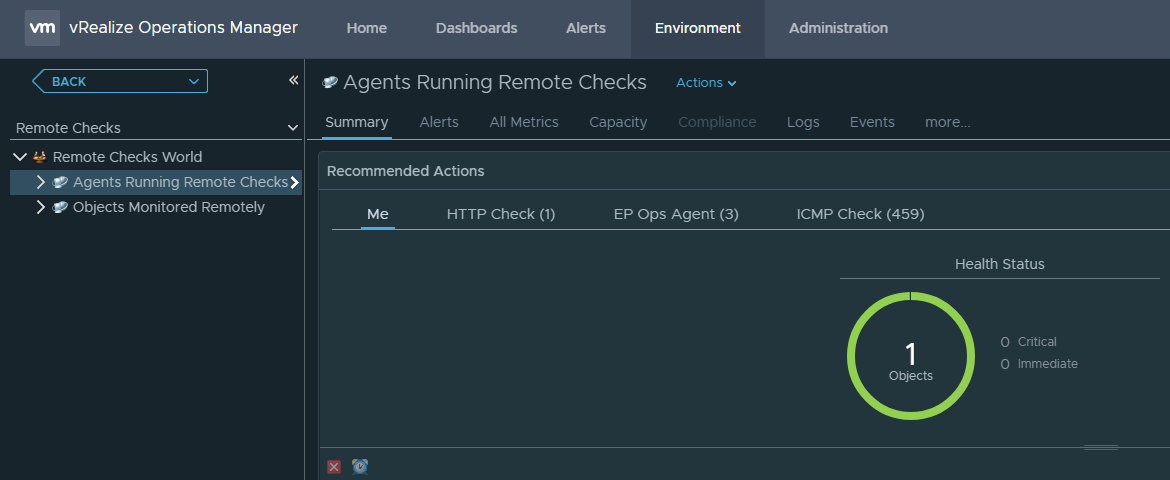
This is a really convenient view to keep track of the remote checks you’ve created and which agents are running them.
It’s also possible to create and delete remote checks using the vROps REST API. I won’t cover that here, but I hope to write another article on that in the near future. As you can see in the above screenshot there are 459 remote ICMP checks. If I had created all of those manually without the API I might have gone crazy.
After creating all of the remote checks I found that about 1/3 of them were not working. The availability metric was consistently 0 on the metric chart, even though I was able to ping the IP addresses from the Photon OS machines that were performing the remote checks. My initial thought was that it could be load based, so I deployed a 3rd Photon OS VM and moved some of the remote checks to it, but got the same results. I could not find anything in common with the checks that were failing. They were on different subnets, spread across all 3 of my Endpoint Ops agents, and most confusing was the fact that I could ping the addresses from the Endpoint Ops machines.
I decided it might be a good idea to enable debug logging. This can be done in the agent configuration file:
/opt/vmware/epops-agent/conf/agent.properties
Uncomment the lines shown below that have “hyperic” in the name. The Endpoint Operations solution was previously a separate product, now known as vRealize Hyperic, before it was integrated into the core vROps product. It’s probably not necessary to uncomment all of the subsystems listed, but I wasn’t sure specifically which ones were related to remote checks.
#Agent Subsystems: Uncomment individual subsystems to see debug messages.
#-----------------------------------------------------------------------
#log4j.logger.org.hyperic.hq.autoinventory=DEBUG
#log4j.logger.org.hyperic.hq.livedata=DEBUG
#log4j.logger.org.hyperic.hq.measurement=DEBUG
#log4j.logger.org.hyperic.hq.control=DEBUG

#Agent Plugin Implementations
#log4j.logger.org.hyperic.hq.product=DEBUG

#Server Communication
#log4j.logger.org.hyperic.hq.bizapp.client.AgentCallbackClient=DEBUG

#Server Realtime commands dispatcher
#log4j.logger.org.hyperic.hq.agent.server.CommandDispatcher=DEBUG

#Agent Configuration parser
#log4j.logger.org.hyperic.hq.agent.AgentConfig=DEBUG

#Agent plugins loader
#log4j.logger.org.hyperic.util.PluginLoader=DEBUG

#Agent Metrics Scheduler (Scheduling tasks definitions & executions)
#log4j.logger.org.hyperic.hq.agent.server.session.AgentSynchronizer.SchedulerThread=DEBUG

#Agent Plugin Managers
#log4j.logger.org.hyperic.hq.product.MeasurementPluginManager=DEBUG
#log4j.logger.org.hyperic.hq.product.AutoinventoryPluginManager=DEBUG
#log4j.logger.org.hyperic.hq.product.ConfigTrackPluginManager=DEBUG
#log4j.logger.org.hyperic.hq.product.LogTrackPluginManager=DEBUG
#log4j.logger.org.hyperic.hq.product.LiveDataPluginManager=DEBUG
#log4j.logger.org.hyperic.hq.product.ControlPluginManager=DEBUG
After editing the agent.properties file restart the service. On most linux OS’s you can use the service command like so:
service epops-agent restart
If using Photon OS or if the above command fails run:
/etc/init.d/epops-agent restart
Now we should have some debug messages in the log file. Let it run for a few minutes and then let’s take a look at the log:
less +G /opt/vmware/epops-agent/log/agent.log
The “+G” argument opens the file with the cursor at the end of the file. This is handy for opening large log files when you want to start at the end of the file. I could see debug messages now for the remote checks that were working.
18-01-2019 14:10:34,927 UTC DEBUG [pool-1-thread-26] [Collector] name=ICMP Check, thread=pool-1-thread-26, result=Fri Jan 18 14:10:34 UTC 2019 (somehostname.domain.com/172.16.72.132) null values={Availability=100.0, ResponseTime=1.0}
Unfortunately I didn’t see any clues or messages related to the ones that were not working. I bundled up the Endpoint Ops agent logs and opened a support case with VMware. You can simply tar/zip up the log directory containing the agents logs.
tar -czvf epops-agent.tar.gz /opt/vmware/epops-agent/log/
The case went to engineering and after a couple of weeks the solution was surprisingly simple. When you install the Endpoint Ops agent using the RPM installation it creates an epops user account for the agent service to run as. We changed the service to have the agent run as the root user instead. To do this, edit the init script located here:
/etc/init.d/epops-agent
Find the line containing “RUN_AS_USER” and change it to root like so:
RUN_AS_USER=root
Restart the service.
/etc/init.d/epops-agent restart
Surprisingly all of the remote checks started working. I recall seeing something like this in the past on other blogs covering the Endpoint Ops agent installation on Linux. Unfortunately, it didn’t occur to me to try this because many of the remote checks were already working. We weren’t able to determine exactly what permissions were preventing it from working as a non-root account. VMware Docs has a detailed description for installing the agent using various methods. Embarassingly, the prerequistes in the docs specifically say that if you plan to use ICMP checks the agent must run as root. So, note to self, in the future RTFM! VMware also has a video on installing the agent here.
Comments