

Capturing Network Traffic on ESXi Hosts
This article shares some notes I took on packet captures (specifically using pktcap-uw) and challenges I ran into recently while troubleshooting the boot up and DHCP process for some VMs. If you only need to capture traffic for a specific VM or virtual port and are using a vSphere Distributed Switch (VDS) I’d recommend looking into the port mirroring options available on the VDS (Official VMware Docs - Working With Port Mirroring), and specifically ERSPAN. A fellow blogger has published a great article on using ERSPAN: vSphere Distributed Virtual Switch: Packet analysis using ERSPAN. If you want or need to capture traffic on the ESXi host, then pktcap-uw is your tool. VMware has a nice overview in the KB article Using the pktcap-uw tool in ESXi 5.5 and later (2051814).
The first thing to note is that pktcap-uw only captures inbound traffic by default. In most cases you’ll probably want to capture traffic in both directions. The examples below are for vSphere 5.5 - 6.5 and will start two traces, one using --dir 0 for inbound traffic and and one using --dir 1 for outbound traffic. This results in two separate capture files, but these can easily be merged in Wireshark. In vSphere 6.7 and later you can use --dir 2 to capture traffic in both directions at once.
To capture traffice for a single VM we can specify the virtual switchport. To find it, start esxtop and hit ‘n’ for the network view. Look for the port ID in the left hand column.
[root@esx01:~] esxtop

 2:39:01pm up 44 days 18:44, 1747 worlds, 42 VMs, 239 vCPUs; CPU load average: 0.76, 0.76, 0.78

   PORT-ID USED-BY                         TEAM-PNIC DNAME              PKTTX/s  MbTX/s   PSZTX    PKTRX/s  MbRX/
  33554433 Management                            n/a DvsPortset-0          0.00    0.00    0.00       0.00    0.0
  33554434 LACP_MgmtPort                         n/a DvsPortset-0          0.00    0.00    0.00       0.00    0.0
  33554435 TST_LAG                               n/a DvsPortset-0          0.00    0.00    0.00       0.00    0.0
  33554436 vmnic0                                  - DvsPortset-0       1318.80    3.65  363.00    3360.02   17.2
  33554437 Shadow of vmnic0                      n/a DvsPortset-0          0.00    0.00    0.00       0.00    0.0
  33554438 vmnic1                                  - DvsPortset-0       2080.28    5.41  340.00    2033.96    3.0
  33554439 Shadow of vmnic1                      n/a DvsPortset-0          0.00    0.00    0.00       0.00    0.0
  33554440 vmk0                             TST_LAG* DvsPortset-0         86.47    0.20  301.00      34.33    0.0
  33554441 vmk1                             TST_LAG* DvsPortset-0          0.00    0.00    0.00       0.00    0.0
  33554742 4534232:testvm1.eth0             TST_LAG* DvsPortset-0        199.64    0.42  272.00     306.45    0.3
  33554744 4534241:testvm2.eth0             TST_LAG* DvsPortset-0        356.04    1.03  377.00     451.95    1.4
For this example let’s use ‘testvm1’ which is port ID 33554742. To capture traffice in both directions and save it to files in /tmp the command looks like:
[root@esx01:~] pktcap-uw --switchport 33554742 --dir 0 -o /tmp/33554742-dir0.pcap & pktcap-uw --switchport 33554742 --dir 1 -o /tmp/33554742-dir1.pcap
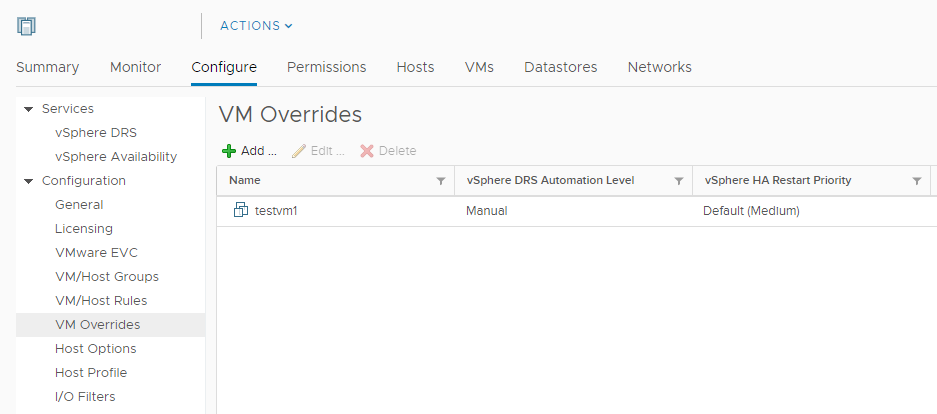
Using the port ID is ideal on a busy host where you only want to capture traffic from a specific VM, however be aware that the port ID can change on a reboot. In my experience restarting the guest will not change the port ID, but a reset or power cycle will. If you’re troubleshooting the boot up process and might have to reset the VM this probably isn’t the best option to use. If the port ID changes the pktcap-uw process continues to run on the old port ID and is capturing nothing from that point forward. It’s also worth noting that in a DRS cluster you don’t want the VM to move to a different host when it restarts. The simplest way to temporarily disable this is to add a “VM Override” in the Cluster’s configuration and set the DRS Automation Level to Manual:
An alternative to the port ID is to specify the uplinks to capture traffic on. This will potentially result in a much larger capture file since it is going to capture all traffic on one or more uplinks. You’ll want to capture traffic on both uplinks in a team/LAG which results in 4 captures running simultaneously. In this scenario I ran into two issues with writing the capture files to /tmp. The first error was not really clear, simply logging "Join with dump thread failed" and only happened occasionally, but would result in one of the capture processes stopping prematurely while the other one continued running:
Accept...Vsock connection from port 1043 cid 2
Accept...Vsock connection from port 1044 cid 2
Dump: 385949, broken : 0, drop: 0, file err: 0Join with dump thread failedDestroying session 18
The other error was clearly a write error and was consistently re-occurring once the /tmp volume was full:
Local CID 2
Listen on port 45097
Local CID 2
Listen on port 45098
Accept...Vsock connection from port 1030 cid 2
Accept...Vsock connection from port 1029 cid 2
Dump: 9344, broken : 0, drop: 0, file err: 0error: Error writing 16 bytes of pkt header to file
Join with dump thread failedDestroying session 5

Dumped 10241 packet to file /tmp/vmnic0.pcap, dropped 0 packets.
Done.
Using vdf -h I could see that /tmp was out of space. It didn’t have a lot of space to begin with and it’s no surprise it was quickly filled up with the capture data.
[root@esx01:~] vdf -h
Ramdisk                   Size      Used Available Use% Mounted on
root                       32M        3M       28M  10% --
etc                        28M        5M       22M  19% --
opt                        32M        4K       31M   0% --
var                        48M      520K       47M   1% --
tmp                       256M      255M      364K  99% --
Changing the output files to write to a datastore not only fixed the space issue, but I didn’t have any more issues with one of the processes stopping prematurely. Here is the resulting command that I used, starting a capture in both directions on two uplinks in a LAG (resulting in a total of 4 capture processes) and writing the output to a datastore.
[root@esx01:~] pktcap-uw --uplink vmnic0 --dir 0 -o /vmfs/volumes/datastore1/vmnic0-dir0.pcap & pktcap-uw --uplink vmnic0 --dir 1 -o /vmfs/volumes/datastore1/vmnic0-dir1.pcap & pktcap-uw --uplink vmnic1 --dir 0 -o /vmfs/volumes/datastore1/vmnic1-dir0.pcap & pktcap-uw --uplink vmnic1 --dir 1 -o /vmfs/volumes/datastore/vmnic1-dir1.pcap
In vSphere 6.7 this should be able to be simplified to the following, but I have not tested this.
[root@esx01:~] pktcap-uw --uplink vmnic0 --dir 2 -o /vmfs/volumes/datastore1/vmnic0.pcap & pktcap-uw --uplink vmnic1 --dir 2 -o /vmfs/volumes/datastore1/vmnic1.pcap
To stop all of the capture processes, run the following command that is provided in the KB referenced above.
kill $(lsof |grep pktcap-uw |awk '{print $1}'| sort -u)
To summarize:
- Use VDS port mirroring if possible
- Don’t use
--switchportwhen rebooting VMs (use--uplinkinstead) - Temporarily set the DRS automation level to manual if necessary
- Save output files to a datastore with plenty of free space
- Remember to capture traffic for all uplinks in a LAG and both directions (
--dir 2) if necessary
Comments